
PopulationCurve draws population growth on axes of time against population, from 0 to
years in duration seconds from delay, a dot at the head of each curve. Its model is
one of three:
PopulationModel::Logistic: growth fromn0at raterlevels off at the dashed carrying capacityk. Withcomparethe exponential curve with the same start and rate is drawn faded beside it, until it leaves the top.PopulationModel::Exponential: the same growth with no limit.PopulationModel::PredatorPrey: Lotka-Volterra, with prey and predators rising and falling in turn.PopulationModel::PREDATOR_PREYcycles about every six time units.
A legend names each curve in its colour from colors. series(count) gives the values the
curves draw. Gallery scenes: PopulationCurve (logistic) and PredatorPrey.
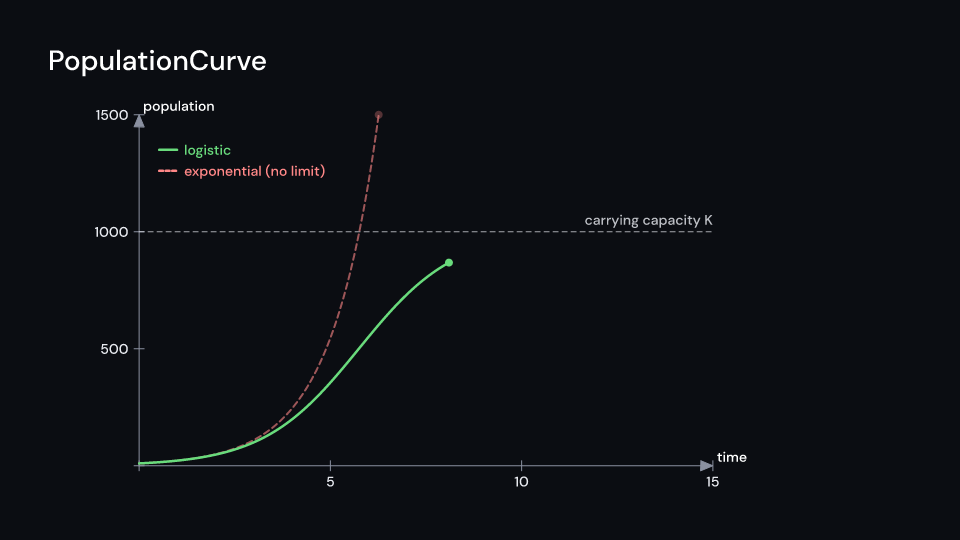
PopulationCurve 7 s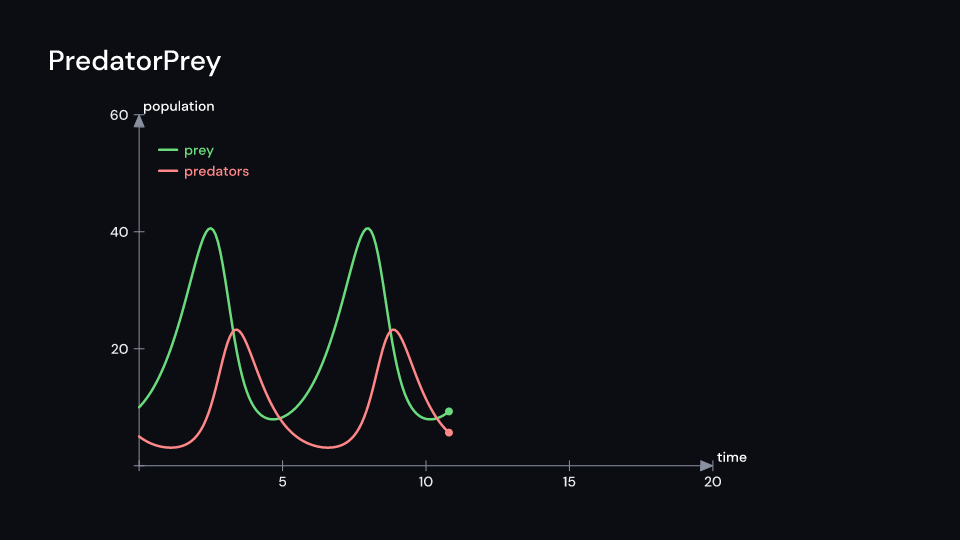
PredatorPrey 7 suse fframes_kit::prelude::*;
let logistic = PopulationCurve { k: 500.0, n0: 5.0, ..PopulationCurve::default() };let n = &logistic.series(100)[0];assert!((n[100] - 500.0).abs() < 5.0); // levelled off at K
fn cycles<'a>(ui: &mut Ui<'a, '_, '_>) -> Svgr<'a> { ui.show(PopulationCurve { model: PopulationModel::PREDATOR_PREY, years: 20.0, ..ui.defaults() })}Components are plain structs. Set the fields you need and fill the rest with ..ui.defaults(): the defaults below come from the current theme (theme. values are fields of Theme).
PopulationCurve
Section titled “PopulationCurve”| Field | Type | Default | Description |
|---|---|---|---|
model |
PopulationModel |
PopulationModel::Logistic |
Which curves: Logistic, Exponential or PredatorPrey. |
r |
f64 |
0.8 |
Growth rate per year (per unit of the time axis). |
k |
f64 |
1000.0 |
Carrying capacity, the population a logistic curve levels off at; it also sets the height of the vertical axis. |
n0 |
f64 |
10.0 |
Starting population at time 0. |
years |
f64 |
15.0 |
Length of the time axis; the curves run from 0 to years. |
compare |
bool |
true |
Draws the faded exponential curve beside a logistic one when true. |
delay |
f32 |
0.0 |
Seconds after the container’s start before the curves begin to draw. |
duration |
f32 |
5.0 |
Seconds the curves take to draw from 0 to years. |
center |
(f64, f64) |
(-0.8, -0.3) |
The middle of the axes, in units of ui.space. |
x_length |
f64 |
8.5 |
Width of the axes, in units of ui.space. |
y_length |
f64 |
5.2 |
Height of the axes, in units of ui.space. |
colors |
[Color; 2] |
[Color::hex("#69db7c"), Color::hex("#ff8787")] |
Colours of the first and the second curve; a faded comparison curve uses the second. |
axis_color |
Color |
theme.colors.muted |
Colour of the axes. |
label_style |
TextStyle |
label_style |
The font of the axis labels, numbers and legend: family, size in pixels and weight. |
text_color |
Color |
theme.colors.text |
Colour of the legend and the carrying-capacity label. |
enter |
Option<FadeIn> |
None |
Fade in at the start; None for none. |
exit |
Option<FadeOut> |
None |
Fade out before the end; None for none. |
Methods:
fn series(&self, count: usize) -> Vec<Vec<f64>>: The populations atcount + 1evenly spaced times from 0 toyears: one series, or prey and then predators.
Feature biology · Source