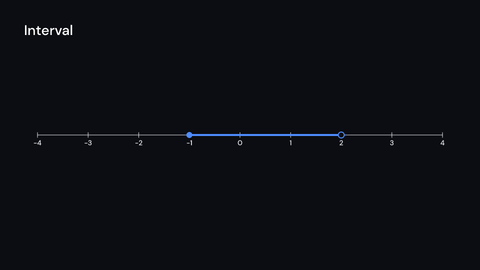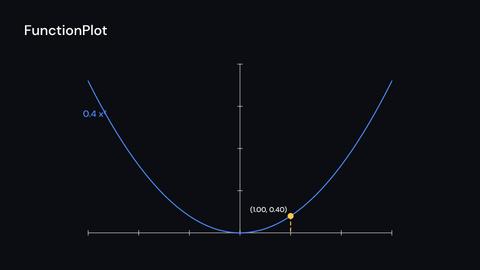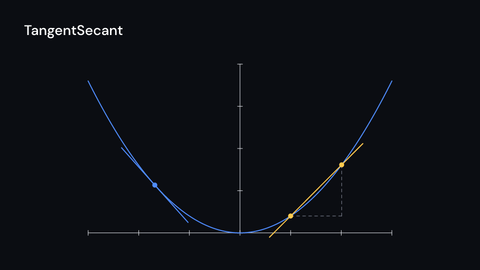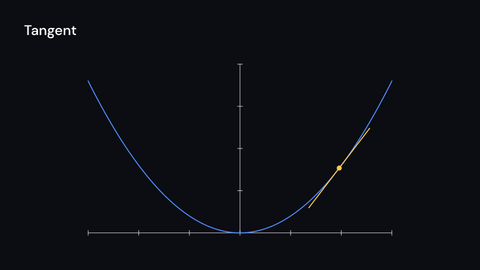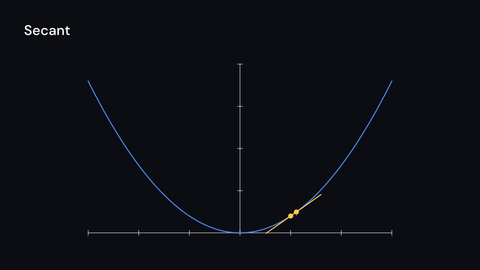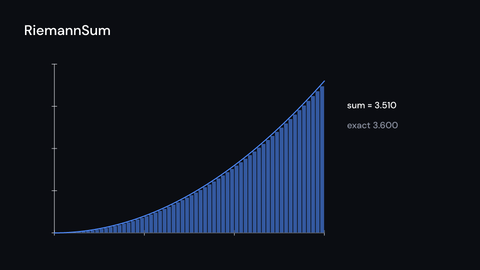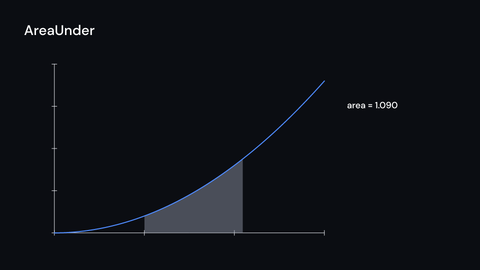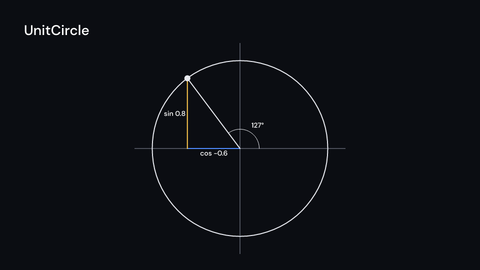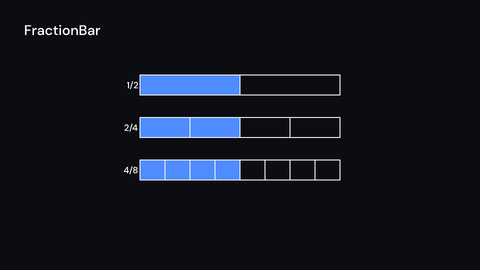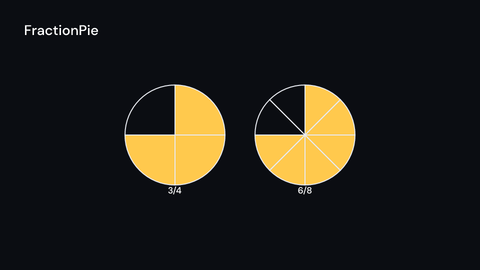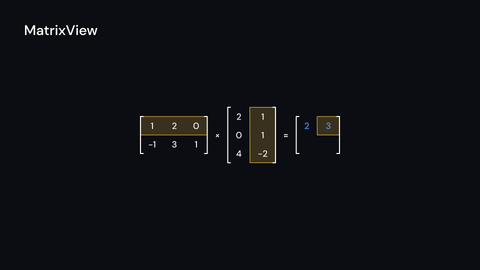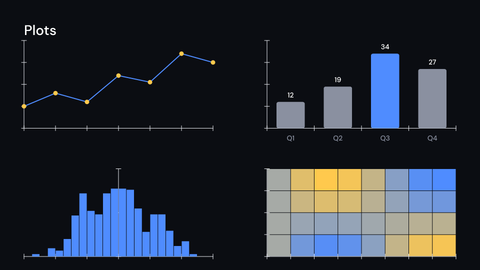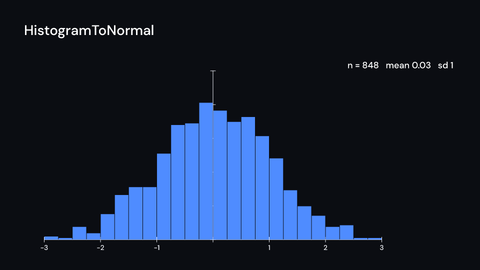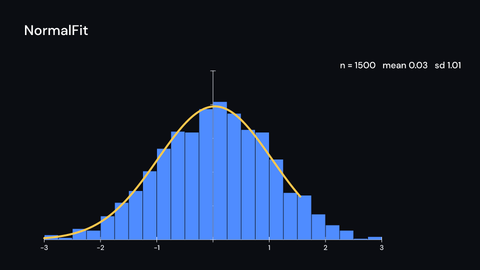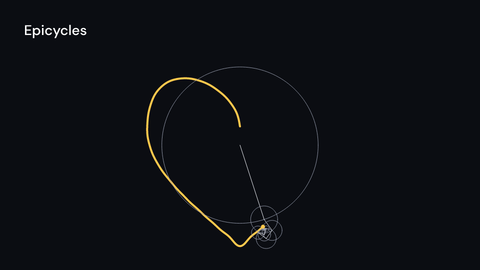
The math kit is the math feature of fframes-kit
(fframes-kit = { .., features = ["math"] }). Its figures are built from the explain layer
(Axes, NumberLine, FunctionGraph, see the explain module docs) and come with the
prelude. Animated values are ValueTrackers: a timeline! stored in the video and read
with ui.sample. Every entry names its scene in the components gallery
(cargo run --release -p components-gallery -- strip <Scene> -n 8).
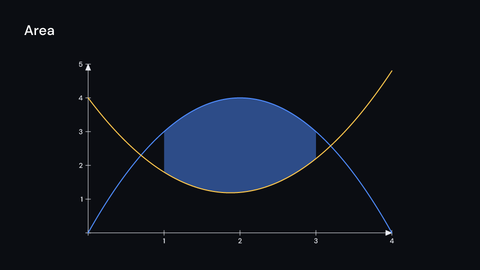
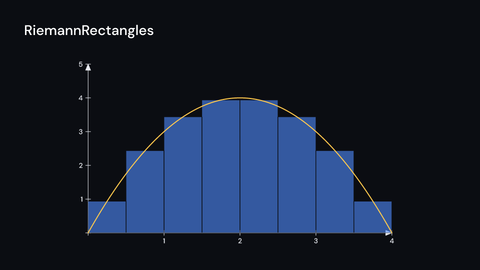
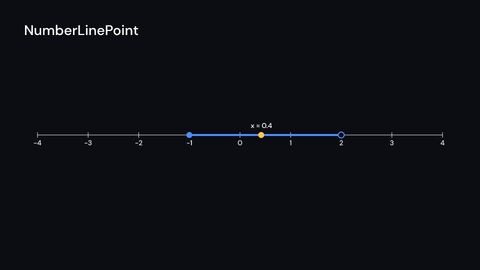
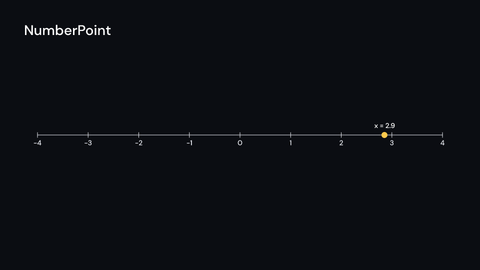
The calculus figures are overlays. They take the mapping of the line or axes they sit on
and draw only themselves, so you show the line or axes once and put several figures on it.
FunctionPlot draws its axes too. An Axes with y_scaling: Scaling::LogBase(10.0) (or
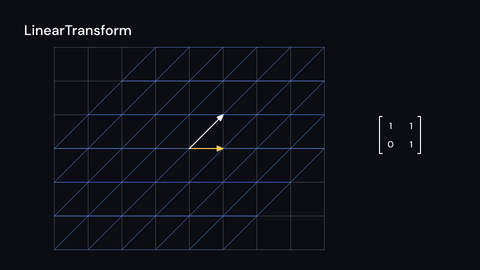
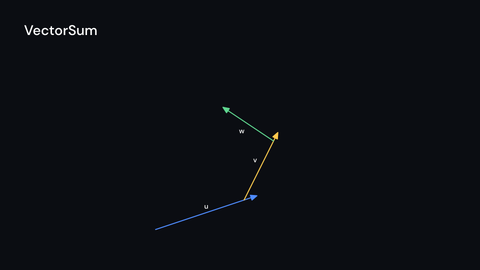
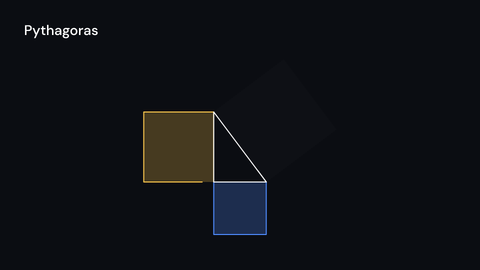
x_scaling) is logarithmic; its range is in exponents and the figures on it take values. The geometry figures (UnitCircle, LinearTransform,
VectorSum, Pythagoras) stand alone and are placed in units of ui.space; show them in
a ui.with_space(..) to draw them at another scale.